Gold Technical Outlook: Descending Channel Still Controls Price as Short-Term Exhaustion Builds
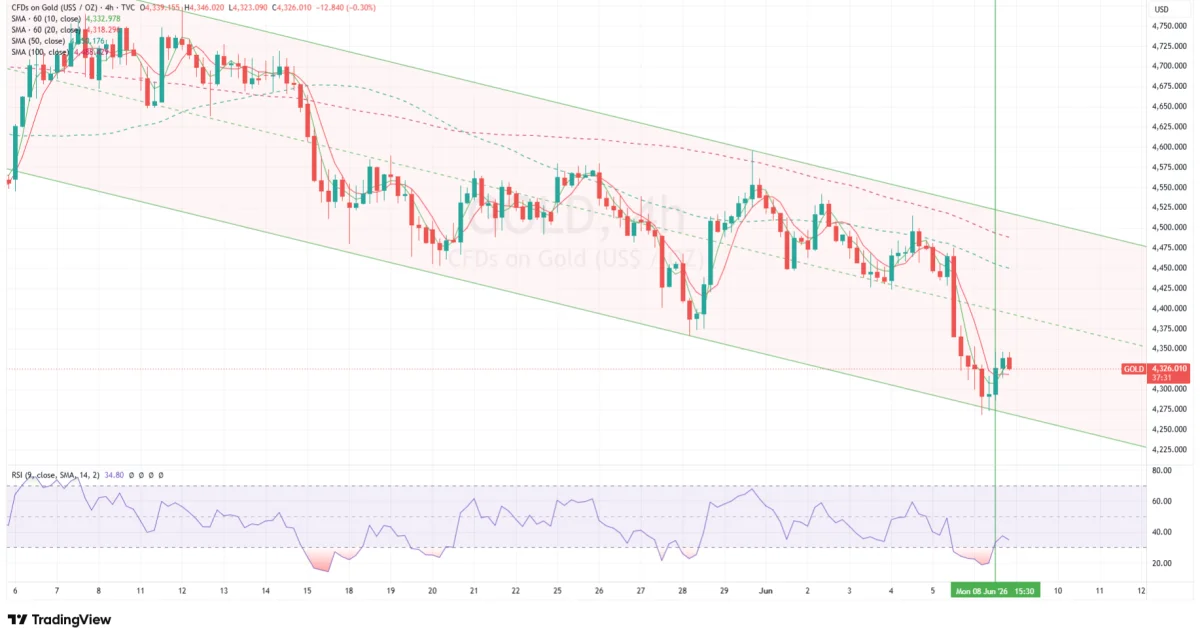
Gold continues to respect the broader descending channel structure on the 4-hour chart, showing that sellers remain in control of the larger trend. The latest price action confirms that every recovery attempt has been capped near the upper side of the channel or near short-term moving average resistance, while downside breaks have continued to attract momentum selling.
The chart shows a clean bearish structure from the recent highs near the $4,700–$4,750 region. Since then, Gold has continued forming lower highs and lower lows inside the descending channel. This tells us that the broader market direction is still weak, even though price is now showing signs of short-term exhaustion after a sharp drop.
At the time of the chart, Gold is trading around the $4,326 region after bouncing from the lower boundary of the descending channel. This bounce is important because it shows that sellers may be taking profit near the lower side of the structure, while short-term buyers are trying to defend the oversold area.
Descending Channel Remains the Main Structure
The most important part of the chart is the descending channel.
Gold has been moving lower inside this channel for several weeks. The upper boundary has acted as resistance, while the lower boundary has repeatedly attracted short-term buying interest.
This type of structure usually means the market is in a controlled downtrend. As long as price remains inside the channel, rallies are more likely to be treated as corrections rather than full bullish reversals.
For now, the key channel zones are:
Upper channel resistance: around $4,450–$4,500
Mid-channel area: around $4,370–$4,400
Lower channel support: around $4,250–$4,275
Gold recently touched the lower side of the channel and bounced, which means a short-term recovery is possible. However, the broader trend still remains bearish unless price breaks above the channel resistance.
RSI Shows Short-Term Exhaustion
The RSI dropped into oversold territory during the latest selloff and has now started to recover.
This is an important signal because when RSI becomes deeply oversold, sellers may become exhausted in the short term. It does not mean the main trend has reversed, but it does suggest that the market may need a pullback or consolidation before continuing lower.
The RSI is now moving back toward the 30–40 zone. This shows that bearish pressure has cooled slightly, but momentum is still not strong enough to confirm a bullish reversal.
In simple terms:
RSI is saying Gold may bounce short term, but not yet reverse long term.
A stronger bullish signal would need RSI to move above 50 and hold there. Until that happens, the recovery should still be viewed with caution.
MA 10/20 Shows Selling Exhaustion but Not a Trend Change
The shorter moving averages, especially the 10 and 20-period averages, are also showing signs of exhaustion after the sharp decline.
Price moved too far away from the short-term averages during the selloff, which often creates a technical snapback. This is why Gold bounced after hitting the lower channel area.
However, the 10/20 moving average structure still does not show a strong bullish crossover or clean upside confirmation. Price is still struggling around the short-term moving average zone, which means sellers may return if the recovery loses strength.
The short-term moving averages are now acting as the first test for buyers.
If Gold can hold above the 10/20 MA zone, a corrective move toward $4,370–$4,400 becomes possible.
If price fails near these averages, sellers may push Gold back toward $4,275 and possibly lower.
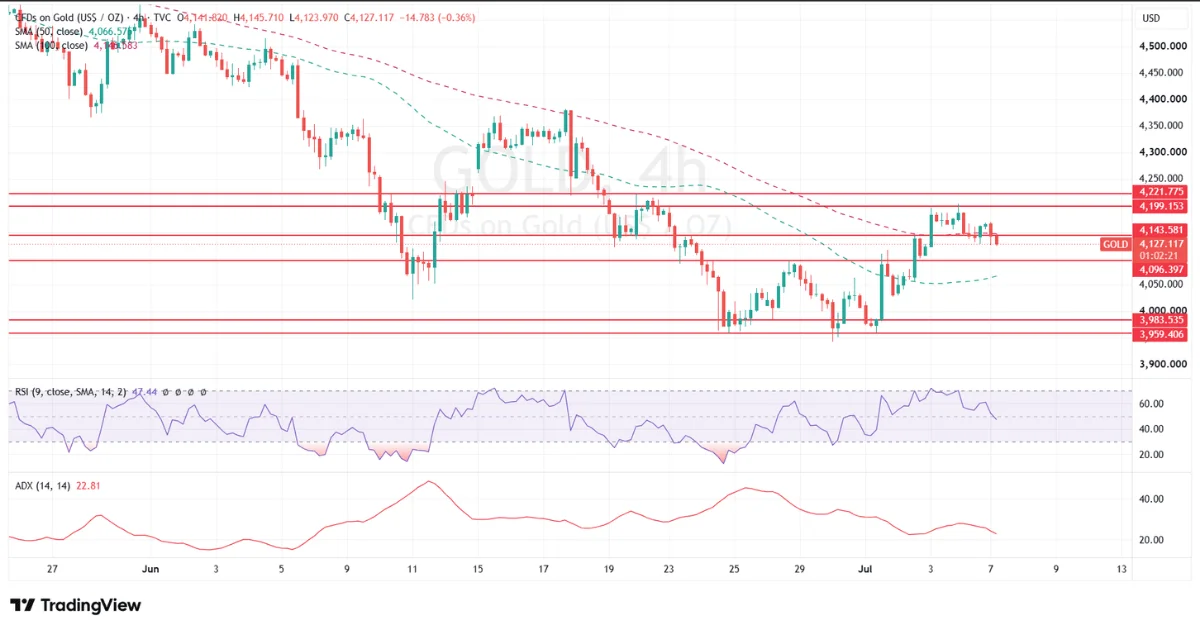
MA 50/100 Still Points to Downside Risk
The larger moving averages remain bearish.
The 50 and 100-period moving averages are still positioned above price and continue to slope lower. This shows that the broader trend remains under pressure.
This is important because even if Gold bounces in the short term, the larger moving average structure suggests that sellers still have control from a trend perspective.
The 50/100 moving averages are likely to act as dynamic resistance if Gold recovers.
The main upside zones to watch are:
$4,370–$4,400: first recovery zone
$4,425–$4,450: stronger resistance
$4,475–$4,500: major trend resistance
A move into these areas could attract fresh selling unless price breaks strongly above them.
Can Gold Pick Up in the Short Term?
Yes, Gold can pick up in the short term because the market is showing exhaustion near the lower side of the descending channel.
The bounce from the lower channel boundary, oversold RSI recovery, and short-term MA exhaustion all suggest that Gold may attempt a corrective recovery.
However, this should be seen as a short-term recovery within a broader bearish structure, not a confirmed trend reversal.
For Gold to show real bullish strength, it needs to break above:
$4,400 first, then $4,450
A clean move above $4,450 would suggest that buyers are gaining stronger control and that the channel resistance may come into focus.
But if Gold fails below $4,400, the move may simply become another bearish retest before the next leg lower.
Key Support and Resistance Levels
Immediate support:
$4,300
$4,275
$4,250
Major downside support:
$4,225
$4,200
Immediate resistance:
$4,350
$4,370
$4,400
Major resistance:
$4,450
$4,475
$4,500
The $4,300 region is important in the very short term. If Gold holds above this area, buyers may attempt a corrective push higher. If this level breaks again, the lower channel support near $4,250 may come back into focus.
Possible Scenarios Ahead
Bullish Short-Term Recovery Scenario
Gold may continue recovering if price holds above $4,300 and RSI continues improving. In this case, buyers may target $4,370 first and then $4,400.
If momentum improves further, Gold could extend toward $4,425–$4,450, where stronger sellers may return.
This scenario would be a corrective bounce inside the descending channel.
Bearish Continuation Scenario
If Gold fails near $4,350–$4,370 and moves back below $4,300, sellers may regain control.
A break below $4,275 would expose $4,250 and then $4,225.
If the lower channel breaks clearly, the downtrend could accelerate further.
Trend Reversal Scenario
For a real bullish reversal, Gold needs to break above the descending channel and hold above the 50/100 MA resistance zone.
That means price needs to reclaim the $4,450–$4,500 region with strength.
Until that happens, the larger technical structure remains bearish.
BonusPips View
Gold is currently in a technical battle between short-term exhaustion and medium-term bearish trend pressure.
The RSI and 10/20 moving averages suggest sellers may be tired in the short term. This can allow Gold to bounce toward $4,370–$4,400.
However, the descending channel and 50/100 moving averages still point to downside risk. This means any short-term rally should be watched carefully for rejection.
The best way to read the current structure is:
Short-term bounce possible, but broader trend still bearish below $4,450–$4,500.
If Gold holds above $4,300, a recovery attempt can continue. But if price breaks back below $4,275, the market may return to bearish continuation mode.
For now, traders should not chase Gold blindly at the lows, but they should also avoid calling a major reversal too early. The channel remains in control until price proves otherwise.
0 Comments