Gold Technical Analysis: XAU/USD Stalls Below $4,145 as Inflation Risks Keep Sellers Active
Gold remains under pressure after failing to hold above the $4,140–$4,145 resistance area.
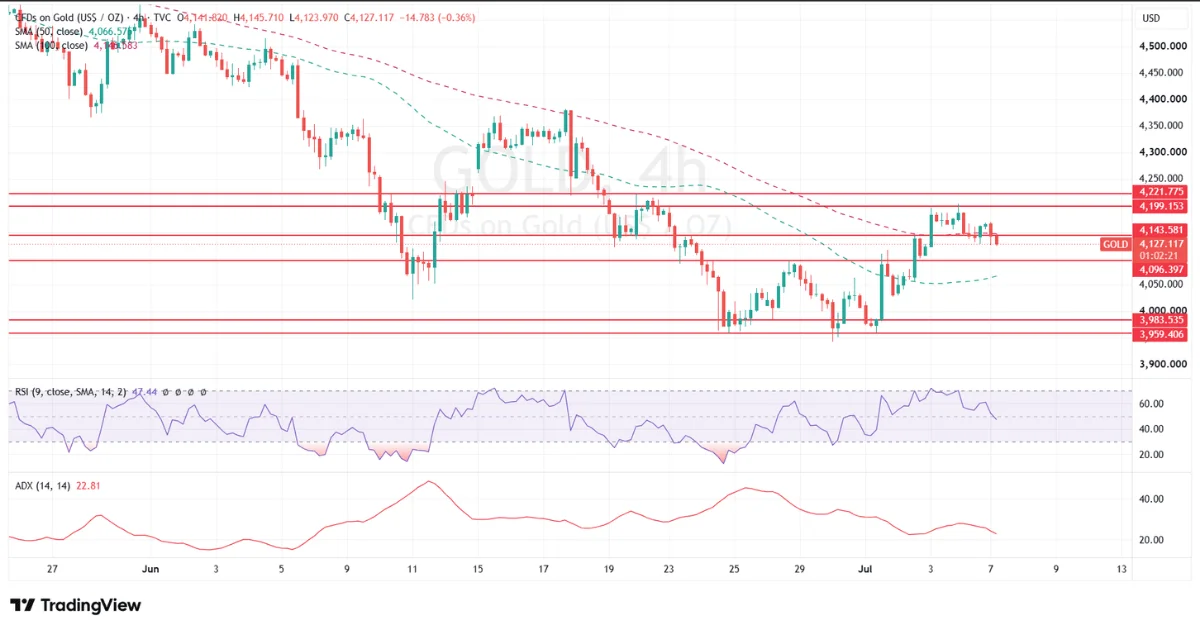
XAU/USD is trading near $4,127 on the 4-hour chart, after recovering from the recent $3,960–$3,985 demand zone. The rebound was strong enough to move gold back above $4,100, but buyers have not yet managed to break the key resistance levels overhead.
The current price action shows a market in recovery mode, but not yet in a confirmed bullish reversal.
Gold remains trapped between near-term support around $4,096 and resistance near $4,144. The next clear move will likely depend on whether buyers can reclaim the 100-period moving average or whether sellers push price back below $4,096.
Gold Holds Above the 50 SMA but Remains Below the 100 SMA
The 4-hour 50-period SMA is currently near $4,067.
Gold remains above this moving average, which gives buyers some short-term support. It also shows that the recent rebound from the lower support area is still technically active.
However, the 100-period SMA sits near $4,146.
This is important because price is still trading below it. The 100 SMA is acting as a dynamic resistance level and is closely aligned with the horizontal resistance near $4,143.
As long as gold remains below this zone, the broader 4-hour structure remains cautious.
A sustained break above the 100 SMA would be the first major signal that buyers are regaining control.
$4,143 Is the Immediate Resistance Level
The first major resistance sits around:
$4,143–$4,146
This area includes the current horizontal resistance and the 100-period moving average.
Gold has already tested this zone and failed to hold above it. That makes it a key decision area for the coming sessions.
If buyers can push price above $4,146 and hold there, the next upside target may be:
$4,195–$4,222
These levels represent the next major resistance band on the chart. A move above $4,222 would improve the short-term structure and could signal that the recent pullback is losing momentum.
However, until gold clears $4,143–$4,146, rallies may continue to attract sellers.
$4,096 Is the First Support to Watch
The first important support is around:
$4,096
This level has acted as a key reaction point during the recent recovery.
If gold holds above $4,096, buyers may continue trying to challenge the $4,143 resistance zone.
But a break below $4,096 would weaken the recovery and increase the risk of a move back toward the lower support levels.
Below $4,096, the next major support zone is:
$3,984–$3,959
This was the area where buyers returned strongly during the recent decline. It remains the key demand zone on the chart.
A break below $3,959 would be a stronger bearish signal and could expose the $3,900 area.
RSI Shows Neutral to Slightly Bearish Momentum
The RSI is near 47 on the 4-hour chart.
This shows that gold is neither overbought nor oversold. Momentum has improved from the recent lows, but buyers have not gained enough strength to push RSI above the 50–60 zone.
For a stronger bullish case, RSI needs to move and hold above 50.
If RSI falls below 40 again, it would show that bearish momentum is returning and sellers may regain control.
The ADX is near 23, which suggests that the market has a developing trend but not an extremely strong directional move.
This supports the idea that gold may remain range-bound between $4,096 and $4,143 before the next breakout.
Inflation Risks Are Limiting Gold Upside
The fundamental backdrop remains mixed.
Gold is receiving some support from reduced expectations of further Federal Reserve rate hikes after the weak US payroll report. Softer employment data has reduced confidence that the Fed will need to tighten policy further in the near term.
This has kept the U.S. Dollar from gaining strong upside momentum.
However, inflation concerns have returned because oil prices are rising again amid renewed Strait of Hormuz risk. Higher oil prices can lift inflation expectations and push Treasury yields higher.
That creates pressure on gold.
Gold normally benefits from a weaker Dollar and lower yields. But if oil-driven inflation concerns keep yields elevated, bullion may struggle to extend gains even when the Dollar is soft.
This is why the current price action remains cautious.
FOMC Minutes Could Be the Next Major Driver
The next major event for gold traders is the release of the FOMC meeting minutes.
Markets will look for clues on how strongly Fed officials are concerned about inflation, labour-market cooling and future rate policy.
A more hawkish set of minutes could support Treasury yields and pressure gold lower.
A more cautious discussion around employment, demand or future inflation trends could support gold and weaken the Dollar.
Traders should also watch oil prices and any fresh developments around the Strait of Hormuz. A stronger oil move can keep inflation fears active and limit gold upside.
Bullish Scenario for Gold
The bullish case requires gold to hold above $4,096 and break above $4,143–$4,146.
A sustained 4-hour close above this resistance zone could open the way toward:
$4,195
$4,222
$4,250–$4,300
This scenario becomes stronger if:
- Treasury yields decline
- The Dollar weakens further
- FOMC minutes sound cautious
- Oil prices stabilise
- Risk sentiment becomes more defensive
- RSI moves above 50
Bearish Scenario for Gold
The bearish case remains active while gold trades below $4,143–$4,146.
If price fails again below this area and breaks under $4,096, sellers may target:
$4,000
$3,984
$3,959
A sustained move below $3,959 would weaken the recent recovery and could reopen the path toward lower levels.
This scenario becomes stronger if:
- Treasury yields rise
- Oil-driven inflation concerns increase
- FOMC minutes are hawkish
- The Dollar finds renewed support
- RSI falls below 40
- Price breaks below the 50-period SMA near $4,067
BonusPips View
Gold is currently trading in an important decision zone.
The rebound from the $3,960–$3,985 support region remains active, but buyers are struggling below the $4,143–$4,146 resistance area.
Technically, gold is above the 50 SMA but below the 100 SMA. This confirms that the short-term recovery is still alive, but the broader 4-hour structure has not yet turned bullish.
The key levels are simple:
Above $4,146, gold can target $4,195 and $4,222.
Below $4,096, gold may return toward $3,984 and $3,959.
Fundamentally, weaker US employment data supports gold, but higher oil prices and revived inflation concerns are keeping Treasury yields firm.
For now, gold remains range-bound with a slight bearish bias below $4,146. The next move may depend on FOMC minutes, oil prices and the reaction in Treasury yields.



0 Comments