Gold Technical Analysis: Sellers Take Control as Price Tests March Low
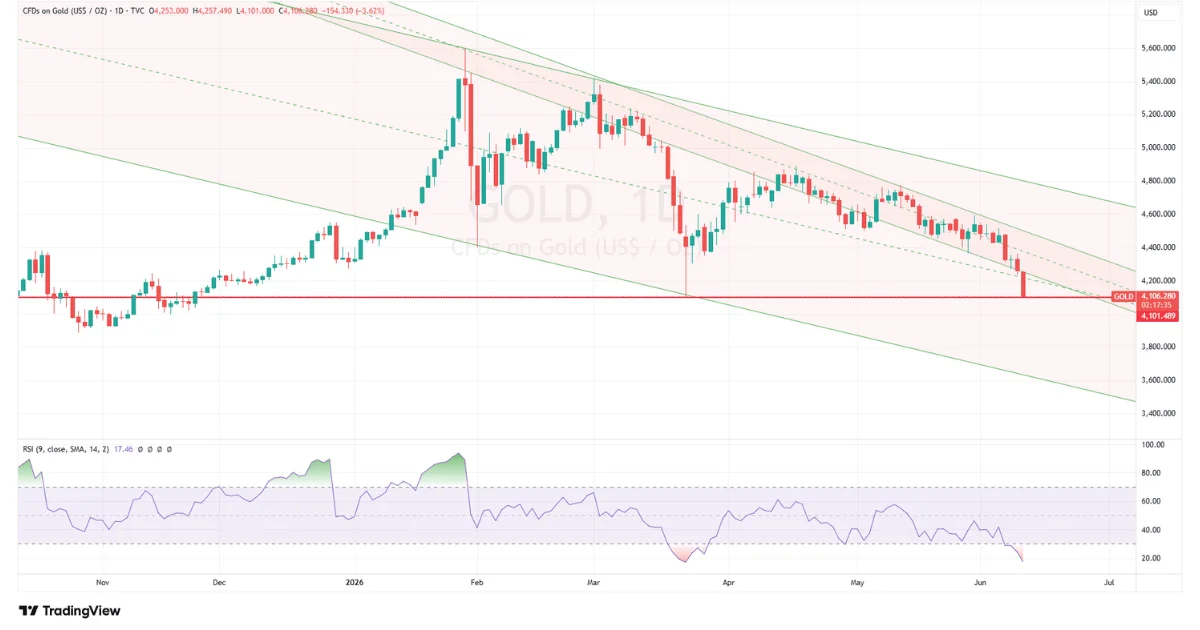
Gold is under heavy selling pressure as price drops more than 3% and moves toward the important March low near $4,098. The daily chart now shows a clear bearish breakdown, with sellers gaining control after gold failed to hold above key moving averages and short-term support zones.
The latest decline is important because gold is not only falling inside a descending channel, but it is also testing one of the most important support areas of the year.
If this area breaks, the technical picture can turn even more negative.
Gold Breaks Lower After Losing Key Support
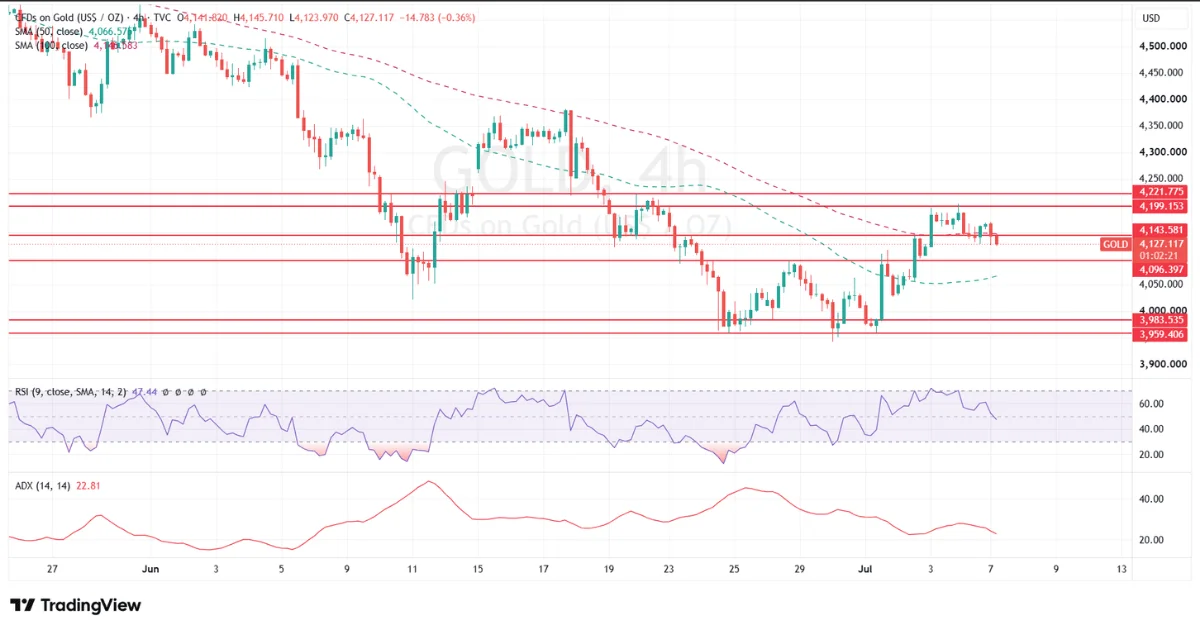
Gold is currently trading around the $4,100–$4,110 zone after a sharp daily decline. The chart shows that price has broken below recent support and is now approaching the March low.
The March low is important because it was the last major area where buyers stepped in strongly. If gold breaks below that level, it would signal that sellers have taken control of the broader trend.
The key March low is around $4,098.74.
Just below that, another important technical level sits near $4,079, which is the 38.2% retracement of the broader rally from the September 2022 low. These two levels are very close to each other, making the $4,080–$4,100 area a major support zone.
Descending Channel Still Controls the Trend
The daily chart shows gold moving inside a clear descending channel.
This channel has been controlling price action since the major high earlier in the year. Every recovery attempt has failed near the upper side of the channel, while sellers have continued to push price toward lower support.
Gold is now trading near the lower side of the recent structure. This means the market is technically stretched, but still bearish.
As long as price remains inside the descending channel and below key resistance, the trend remains in favour of sellers.
200-Day Moving Average Breakdown Adds Pressure
One of the most important technical developments is the break below the 200-day moving average.
The 200-day moving average is widely watched by institutional traders because it helps define the long-term trend. When price breaks below it, long-term buyers often become more cautious, while sellers gain confidence.
The 200-day moving average is around $4,415.
Gold has now moved far below that level, which confirms that the latest decline is not just a small pullback. It is a meaningful technical breakdown.
For buyers to regain confidence, gold needs to recover back above this area. Until that happens, the market may continue to treat rallies as selling opportunities.
RSI Shows Deep Oversold Conditions
The RSI has dropped near 17, which shows that gold is now deeply oversold.
This means selling momentum is very strong. It also means that a short-term bounce can happen at any time, especially near major support.
However, oversold does not mean bullish by itself.
In strong bearish trends, RSI can remain oversold while price continues to fall. Traders should therefore be careful about buying only because RSI is low.
A proper recovery would need price confirmation, not just an oversold signal.
Key Support Levels to Watch
The most important support zone is now:
$4,100–$4,080
This area includes the March low and the 38.2% retracement zone. If buyers defend it, gold may attempt a corrective rebound.
Below that, the next support levels are:
$4,050
$4,000
$3,950
$3,850
A break below $4,080 would be a major bearish signal and could open the way toward the psychological $4,000 level.
If $4,000 also breaks, selling pressure may accelerate further.
Key Resistance Levels to Watch
If gold rebounds, the first resistance area is around:
$4,250
This is the first short-term level where sellers may return.
Above that, the next important resistance levels are:
$4,350–$4,373
$4,415
$4,450
$4,600
The $4,350–$4,373 zone is important because the latest corrective rally failed there before price turned lower again. This makes it a key seller zone.
The $4,415 area is also very important because it is close to the 200-day moving average. A move back above this level would be the first sign that buyers are trying to repair the damage.
Until gold breaks back above $4,350–$4,415, the short-term bias remains bearish.
Bearish Scenario
The bearish scenario remains active as long as gold stays below the $4,350–$4,415 resistance area.
If price breaks below $4,080, sellers may push toward $4,000. A clean daily close below $4,000 would be a strong bearish signal and could bring deeper downside.
This scenario becomes stronger if:
The U.S. Dollar remains firm
Treasury yields stay elevated
Fed rate-hike expectations continue rising
Gold closes below the March low
Safe-haven demand fails to return strongly
In this case, gold may continue to slide inside the descending channel.
Bullish Rebound Scenario
A short-term rebound is possible because gold is deeply oversold and testing major support.
If buyers defend the $4,080–$4,100 zone, price may try to recover toward $4,250 and then $4,350.
However, this would first look like a corrective bounce, not a confirmed trend reversal.
For the bullish case to become stronger, gold needs to recover above $4,415 and then hold above it. That would show that the break below the 200-day moving average was false.
This scenario becomes stronger if:
The Dollar weakens
Treasury yields fall
U.S. data softens
Geopolitical risk increases safe-haven demand
Gold closes back above $4,350–$4,415
Fundamental Background
The technical breakdown is happening at a time when gold is facing heavy pressure from macro fundamentals.
U.S. CPI has kept pressure on the Federal Reserve, and markets are now focused on the possibility that rates may stay high for longer. Some traders are also pricing the risk of more hawkish Fed action if inflation remains sticky.
This is negative for gold because higher yields reduce the appeal of non-yielding assets.
At the same time, the U.S. Dollar remains firm. A stronger Dollar normally pressures gold because it makes the metal more expensive for foreign buyers.
War headlines and Middle East tension can still support gold, but so far safe-haven demand has not been strong enough to offset the pressure from yields and the Dollar.
This is why gold is falling even while geopolitical risks remain active.
BonusPips View
Gold is now at a critical point.
The daily chart is clearly bearish. Price has broken below key support, moved under the 200-day moving average, and is now testing the March low near $4,098. The RSI is deeply oversold, which means a bounce is possible, but the broader structure still favours sellers.
The most important zone is $4,080–$4,100.
If gold holds this area, a corrective rebound toward $4,250 or $4,350 is possible. But if gold breaks below this zone, the next major target becomes the psychological $4,000 level.
For now, rallies may remain selling opportunities unless gold can reclaim the $4,350–$4,415 resistance zone.
The key message is simple:
Gold is technically bearish and testing major support. A break below the March low can open the door for deeper losses, while holding this zone may trigger a short-term rebound.
Fundamentals can still change the picture quickly. If war headlines intensify or the Dollar weakens, gold may recover. But as long as yields stay firm and Fed pressure remains alive, gold remains vulnerable.
0 Comments