Gold Technical Analysis: Bearish Pressure Builds as Price Tests Key Support Zone
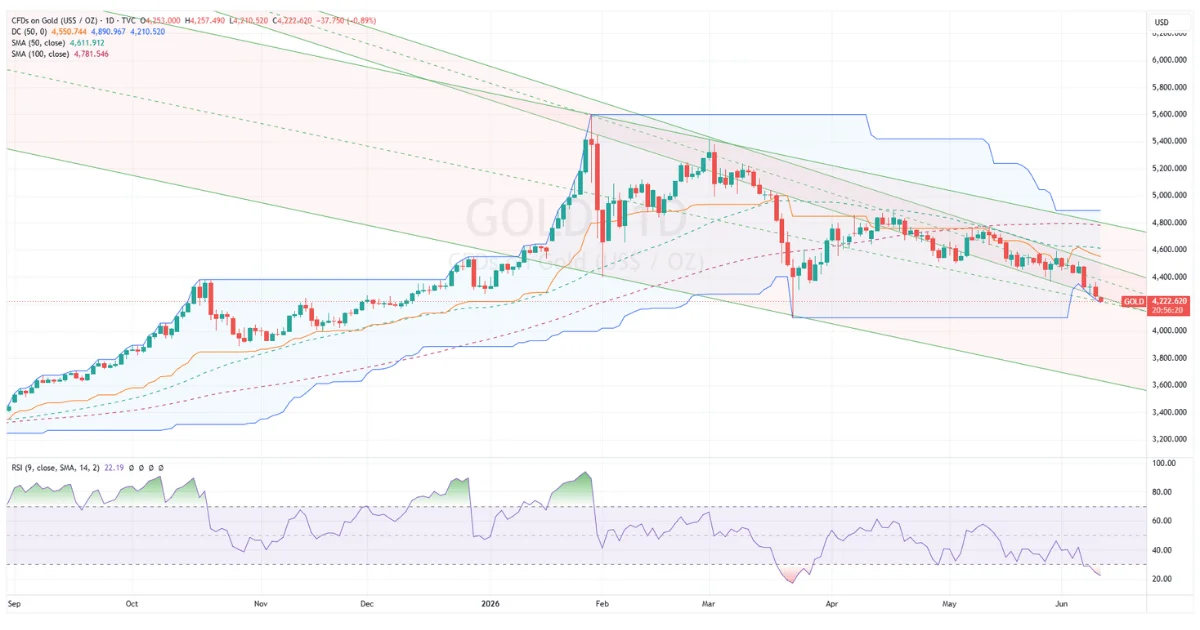
Gold is under pressure again as the daily chart shows price trading near an important support area around the $4,200–$4,225 zone. After failing to hold above the mid-range resistance area in May, gold has continued to move lower inside a broader downward structure.
The chart now shows a market that is technically weak, but also close to a zone where short-term reactions can appear. This makes the current setup very important for traders.
At the same time, fundamentals are creating a mixed environment. War-related headlines can support gold through safe-haven demand, but a stronger U.S. Dollar and rising rate-hike expectations can pressure gold lower. This is why gold is currently stuck between geopolitical support and monetary-policy pressure.
Current Technical Picture
Gold is trading around $4,222, close to the lower side of the recent trading structure. The broader move since the February high shows a clear sequence of lower highs and lower lows.
The price has also remained under the key moving averages, which confirms that sellers are still controlling the market.
The chart shows price below:
50-day moving average near $4,612
100-day moving average near $4,781
This is important because as long as gold remains below these moving averages, the broader daily trend remains weak. Buyers need to push price back above these levels to change the structure.
For now, every recovery attempt is still being treated as a selling opportunity.
Descending Channel Remains Active
The green descending channel on the chart is still controlling the broader direction. Price has been moving lower inside this structure after failing to break higher earlier in the year.
The upper side of the channel has repeatedly acted as resistance, while the lower side is now acting as the next downside target zone.
This means gold is not yet showing a confirmed bullish reversal. It is still moving inside a bearish channel.
A strong daily close below the current support zone could open the door toward the lower channel area.
Key Support Levels
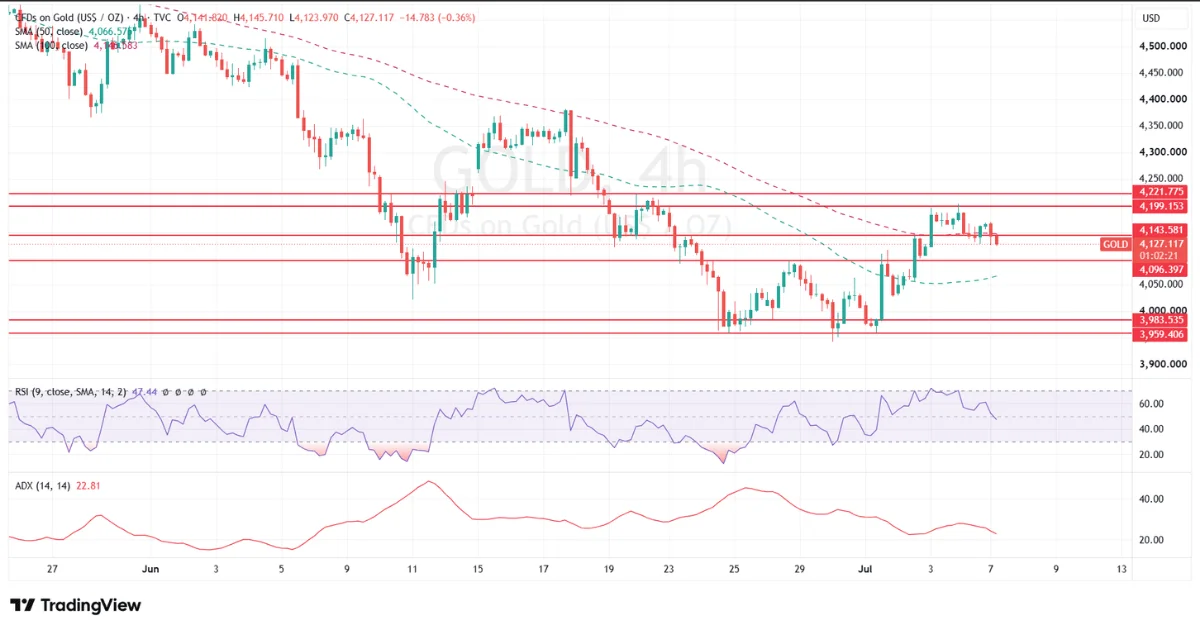
The most important support is now around:
$4,200
$4,150
$4,100
$4,050
The chart shows that gold is already close to the lower support zone that held earlier in March and April. If this area breaks, sellers may try to push gold toward the next psychological level near $4,100.
A clean break below $4,100 would be more bearish and may expose deeper downside toward the lower channel line.
Key Resistance Levels
If gold tries to recover, the first resistance is around:
$4,350
$4,450
$4,600
$4,780–$4,800
The first important short-term resistance is around $4,350–$4,450. This is where sellers may become active again if the broader bearish structure remains valid.
The stronger resistance is near the 50-day moving average around $4,612. A move above this area would show that buyers are trying to regain control.
But the major trend reversal zone remains near the 100-day moving average around $4,780–$4,800. Gold needs to reclaim that zone to confirm a stronger bullish shift.
RSI Shows Weak Momentum
The RSI is near 22, which shows that gold is moving into oversold territory.
This means selling momentum is strong, but it also means the market may be vulnerable to a short-term bounce if sellers start taking profit.
However, oversold RSI does not automatically mean a trend reversal. In a strong bearish move, RSI can stay weak for longer while price continues lower.
For a stronger recovery signal, RSI needs to move back above the 30–35 zone and price needs to close above short-term resistance.
Why Gold Is Moving Lower
Gold is facing pressure from the U.S. Dollar and rate expectations.
When markets expect the Federal Reserve to stay hawkish or even consider higher rates, Treasury yields usually rise. Higher yields make gold less attractive because gold does not pay interest.
This is why stronger U.S. data and rate-hike expectations can pressure gold, even during uncertain geopolitical conditions.
The current environment is therefore difficult for gold buyers. Safe-haven demand is present, but the Dollar and yields are still creating heavy resistance.
War Headlines Can Change the Direction
The biggest risk for gold sellers is geopolitical escalation.
War news, Middle East tensions, attacks near key energy routes, or any major military response can quickly bring safe-haven demand back into gold.
If fear rises sharply, gold can recover even if the Dollar remains strong.
This is why fundamentals can change the course of action very quickly. The chart is currently bearish, but geopolitical headlines can create sudden upside spikes.
Gold is not trading only on technical levels right now. It is also reacting to war headlines, oil prices, the U.S. Dollar, Treasury yields and Fed expectations.
Possible Bearish Scenario
The bearish scenario remains active as long as gold stays below $4,450 and the 50-day moving average.
If price breaks below $4,200, sellers may target $4,150 and then $4,100.
A deeper sell-off could take gold toward $4,050 or even the lower side of the descending channel.
This scenario becomes stronger if:
The U.S. Dollar continues to rise
Treasury yields move higher
Fed rate-hike expectations increase
War headlines fail to create strong safe-haven demand
Gold closes below $4,200
Possible Bullish Scenario
The bullish scenario needs confirmation.
Gold must first defend the $4,200 support zone. After that, price needs to recover above $4,350 and then $4,450.
A close above $4,600 would be the first sign that sellers are losing control. A stronger bullish reversal would need a break above $4,780–$4,800.
This scenario becomes stronger if:
War headlines escalate
Safe-haven demand returns
U.S. yields fall
The Dollar weakens
Gold closes back above the 50-day moving average
BonusPips View
Gold is technically weak at the moment.
The daily chart shows price moving inside a bearish channel, trading below the 50-day and 100-day moving averages, and testing a key support area around $4,200. This means sellers still have control.
However, RSI is oversold, so a short-term bounce is possible from current levels.
The bigger question is whether that bounce becomes a real reversal or just another selling opportunity.
For now, the technical trend remains bearish below $4,450 and especially below the 50-day moving average. A break below $4,200 can open the way toward $4,100 and lower.
But traders should remain careful because fundamentals can quickly change the outlook. If war headlines escalate or safe-haven demand returns strongly, gold can recover sharply even from a bearish technical setup.
The key message is simple:
Gold is technically under pressure, but geopolitical risk can still change the direction quickly.
Until price reclaims the major moving averages, rallies may remain limited. But as long as war headlines remain active, gold sellers should also remain cautious.
0 Comments