Gold Technical Analysis: XAU/USD Slips Toward Key Demand as Weekend War Risk Keeps Traders on Edge
Gold is trading in a sensitive technical zone as sellers regain control after another rejection near the $4,100–$4,120 area.
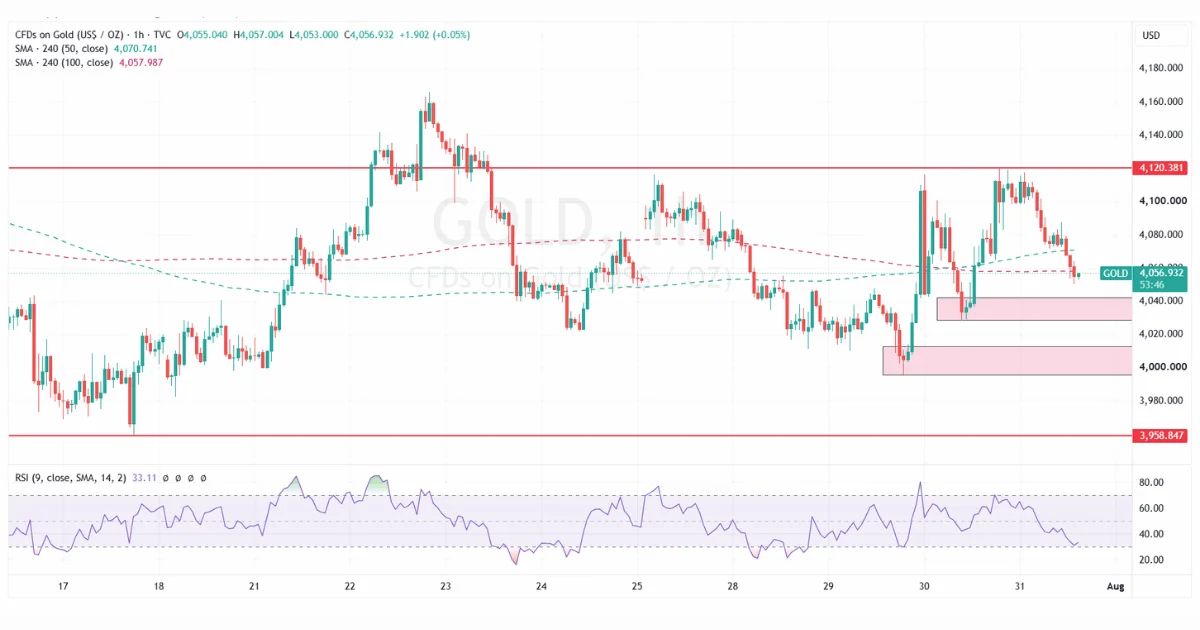
On the 1-hour chart, XAU/USD is trading near $4,057, after failing to hold above the short-term resistance region. Price has now slipped back below the 50-period SMA near $4,071 and is testing the 100-period SMA around $4,058.
This is an important area because gold is no longer showing clean bullish momentum. The market is still holding above demand, but the latest rejection shows that buyers are struggling to build a sustained breakout.
The chart suggests a short-term bearish correction inside a wider consolidation range.
Gold Fails Again Near $4,120 Resistance
The most important resistance on the chart is clearly around:
$4,120
Gold tested this area more than once but failed to break and hold above it.
This rejection matters because $4,120 is not just a random level. It is the upper boundary of the current short-term range. Every failure near this zone shows that sellers are still active at higher prices.
As long as gold remains below $4,120, the bullish case remains incomplete.
A clean break above $4,120 would change the structure and could open the way toward higher resistance levels near $4,140 and $4,160.
But until that happens, rallies toward $4,100–$4,120 may continue to attract profit-taking.
Price Breaks Below the 50 SMA
The 50-period SMA is currently near $4,071.
Gold has moved below this moving average, which weakens the short-term bullish structure.
When price trades below the 50 SMA, it often means buyers are losing control of the immediate trend. The market may still bounce from demand zones, but momentum has shifted from bullish to corrective.
For bulls to regain control, gold needs to reclaim the $4,070–$4,080 region.
If price stays below this zone, sellers may continue to push toward the next support area.
100 SMA Is the Immediate Decision Point
The 100-period SMA is near $4,058, almost exactly where gold is trading now.
This makes the current price area very important.
If gold holds around the 100 SMA and forms a bullish reaction, buyers may attempt another recovery toward $4,070, $4,080 and then $4,100.
But if price breaks clearly below the 100 SMA, the next downside target becomes the demand zone around $4,035–$4,045.
That zone is the first strong support area on the chart.
First Demand Zone: $4,035–$4,045
The first major demand zone is around:
$4,035–$4,045
This area was previously respected after a sharp move higher. Buyers stepped in from this region and pushed gold back toward $4,100.
That makes it a key intraday support zone.
If gold drops into this area, traders should watch the reaction carefully.
A strong rejection from $4,035–$4,045 may create another short-term buying opportunity toward $4,070 and $4,100.
But if sellers break below $4,035 with momentum, the structure becomes weaker and the next support zone comes into focus.
Second Demand Zone: $3,995–$4,012
Below the first demand area, the next important support is:
$3,995–$4,012
This is a deeper demand zone and may become the next major target if gold loses $4,035.
This level is important because it sits close to the psychological $4,000 area.
Gold often reacts strongly around major round numbers, especially during war headlines, Fed uncertainty or weekend risk.
If price reaches this zone before the weekend, buyers may try to defend it aggressively. However, a break below $3,995 would be a clear bearish warning.
Major Support: $3,958
The strongest visible support on the chart is near:
$3,958
This is the lower horizontal support level and a major downside line for the current range.
If gold breaks below $3,958, the market would likely shift from range trading into a deeper bearish continuation move.
A break below this level would show that buyers have failed to defend the broader structure.
Until that happens, gold remains inside a wide consolidation range between $3,958 and $4,120.
RSI Shows Bearish Momentum but Near a Reaction Zone
The RSI is near 33, which shows that bearish momentum has increased.
This is not yet deeply oversold, but it is close to the lower momentum zone.
That means gold may be vulnerable to a short-term bounce if price reaches demand near $4,035–$4,045.
However, RSI below 50 confirms that buyers do not have control right now.
For a stronger bullish signal, RSI needs to recover above 45 first and then move above 50. Without that, any bounce may remain corrective.
If RSI breaks below 30 while price breaks below $4,035, sellers may target the $4,000 area quickly.
Technical Bias: Cautious Bearish Below $4,080
The short-term technical bias is cautious bearish while gold remains below:
$4,070–$4,080
This area includes the 50 SMA and the recent breakdown zone.
If gold cannot reclaim this level, sellers may continue to control the market.
The bearish path is:
Below $4,058 → $4,045 → $4,035 → $4,012 → $3,995 → $3,958
The bullish recovery path is:
Above $4,080 → $4,100 → $4,120 → $4,140 → $4,160
The most important level for bulls is $4,120.
The most important level for bears is $4,035.
Whichever side breaks first may decide the next larger move.
Fundamental View: Gold Is Trapped Between War Risk and Fed Risk
Fundamentally, gold remains difficult to trade because two major forces are fighting each other.
The first force is geopolitical risk.
The war situation, shipping-route disruption and energy-market uncertainty are keeping a safe-haven premium under gold. Traders do not want to go into the weekend too aggressively short gold when Middle East headlines can change quickly.
Any fresh escalation, attack on shipping routes, stronger military response or disruption near major energy chokepoints can trigger a gap higher in gold when markets reopen.
This is why weekend risk matters.
Gold can jump sharply if the market opens on Monday with worse war headlines.
The second force is inflation and Fed risk.
War can support gold through fear, but it can also hurt gold if it pushes oil prices higher and revives inflation concerns.
Higher oil prices can increase inflation expectations. If inflation risk rises again, Treasury yields may move higher and the Federal Reserve may sound more cautious or more hawkish.
That is negative for gold because gold does not pay yield.
This is the current problem for gold bulls.
Geopolitical fear supports gold, but inflation-driven yields limit the upside.
Why War Risk Does Not Always Mean Gold Must Rally
Many traders assume that war headlines automatically push gold higher.
That is not always true.
Gold rallies strongly when war risk creates fear, uncertainty and demand for safety.
But gold can fall during war headlines if the market believes the war will push oil prices higher, inflation higher and interest rates higher.
This is exactly why the current environment is complicated.
If the war creates panic and risk-off flows, gold can rise.
If the war creates inflation pressure and higher yields, gold can struggle.
So traders must watch oil, the Dollar and Treasury yields together.
Gold is not trading only on fear.
It is trading on the balance between fear and Fed policy.
Weekend Risk: Traders Should Be Careful Holding Large Positions
The weekend risk is high.
When markets close, traders cannot react to sudden geopolitical developments. If there are major headlines during the weekend, gold may open with a gap.
Possible bullish weekend risks for gold include:
Fresh military escalation
New attacks near shipping routes
Stronger sanctions or retaliation
Oil supply disruption
Safe-haven demand from risk-off sentiment
Weak Dollar reaction after political or war headlines
Possible bearish weekend risks for gold include:
A pause in fighting
Talks or diplomatic progress
Oil prices falling further
Treasury yields rising on inflation concerns
Dollar strength after hawkish Fed expectations
Profit-taking before new macro data
Because of this, traders should be careful with oversized positions into the weekly close.
Gold can gap in either direction.
What Gold Traders Should Watch Next
The next move in gold will depend on a combination of technical and macro signals.
Important technical levels:
Resistance: $4,080, $4,100, $4,120, $4,140, $4,160
Support: $4,045, $4,035, $4,012, $3,995, $3,958
Important fundamental drivers:
U.S. Dollar direction
Treasury yields
Oil prices
Fed communication
Inflation expectations
Middle East war headlines
Weekend shipping-route risk
Risk sentiment in equities
Safe-haven demand
If yields rise, gold may struggle even if war headlines remain tense.
If yields fall and war risk increases, gold can recover strongly.
Bullish Scenario for Gold
The bullish case requires gold to hold above the $4,035–$4,045 demand zone and recover back above $4,080.
A move above $4,080 would suggest that sellers are losing control.
A break above $4,120 would confirm a stronger bullish breakout.
In that case, gold may target:
$4,140
$4,160
$4,180
This scenario becomes stronger if weekend risk increases, the Dollar weakens and Treasury yields fall.
Bearish Scenario for Gold
The bearish case remains active while gold trades below $4,080 and fails to reclaim the 50 SMA.
A break below $4,035 would increase downside pressure.
Below that level, gold may target:
$4,012
$3,995
$3,958
This scenario becomes stronger if oil-driven inflation fears push yields higher, the Dollar recovers and war headlines do not create strong safe-haven demand.
BonusPips View
Gold is trading in a classic decision zone.
The chart shows clear rejection near $4,120, price is below the 50 SMA, RSI is weak, and the market is now testing the 100 SMA around $4,058.
This gives sellers short-term control.
However, gold is also close to important demand around $4,035–$4,045, and weekend geopolitical risk means traders should avoid treating the downside as risk-free.
The key message is simple:
Gold remains bearish below $4,080, but sellers need a clean break below $4,035 to confirm deeper downside. A recovery above $4,120 would cancel the bearish structure and open the door for a stronger rally.
Fundamentally, the war risk can support gold, but only if safe-haven demand dominates. If the war keeps oil prices high and lifts inflation expectations, rising yields may continue to cap gold rallies.
For now, gold is range-bound with a bearish short-term bias, but weekend risk keeps the market dangerous for both buyers and sellers.



0 Comments