
Gold Technical Analysis: Buyers Regain Control Above $4,050 as $4,120 Returns to Focus
Gold is attempting to rebuild bullish momentum after repeatedly attracting demand near the $4,030–$4,040 region.
XAU/USD has recovered toward $4,074 and moved back above its key short-term moving averages on both the one-hour and four-hour charts.
The immediate structure is constructive, but gold remains inside a broader consolidation range between approximately $3,959 and $4,120.
Buyers must now clear the nearby $4,082–$4,085 resistance zone before the market can make another serious attempt at the upper boundary of the range.
Four-Hour Chart: Moving Averages Turn Supportive
On the four-hour chart, gold is trading above the 50-period moving average near $4,057 and the 100-period moving average around $4,051.
This moving-average cluster creates an important dynamic support region between $4,050 and $4,060.
Holding above this area suggests that short-term control is shifting back toward buyers.
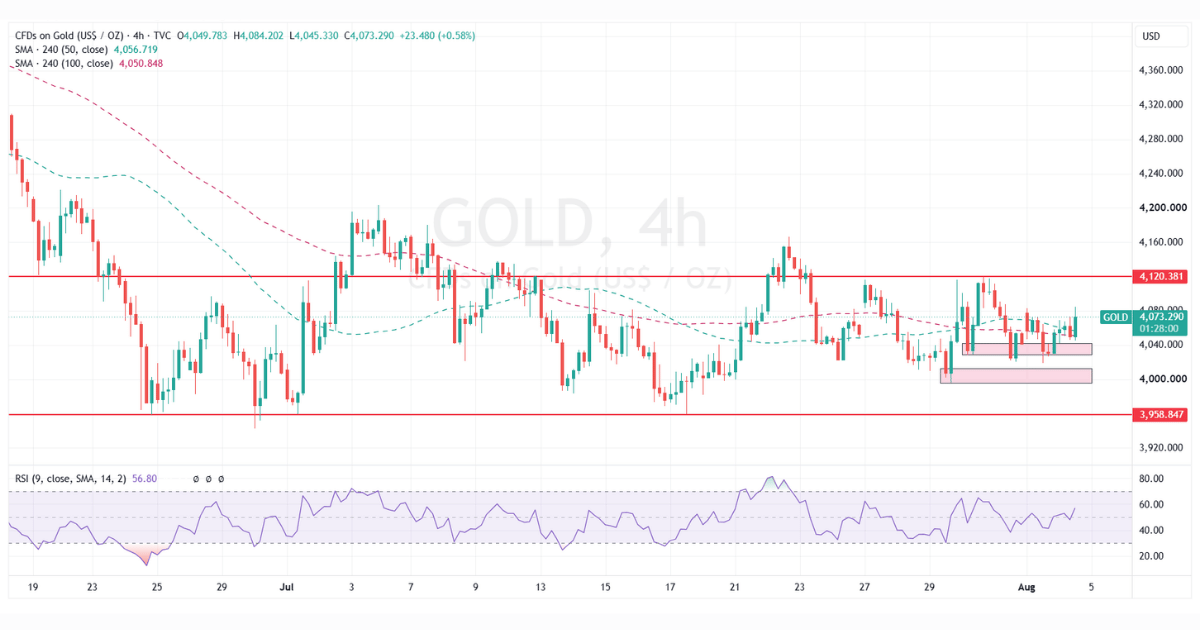 However, the broader market structure remains neutral because price has not yet broken the major resistance at $4,120.
The four-hour RSI has recovered to around 57.
Momentum is positive without being overextended, leaving room for further upside if buyers continue defending the moving-average support region.
Key Resistance Levels for Gold
The first important resistance is positioned around $4,082–$4,085.
This area contains recent intraday highs and represents the next liquidity barrier for buyers.
A sustained break above $4,085 could expose the psychological $4,100 level, followed by the major horizontal resistance at $4,120.
A decisive four-hour close above $4,120 would confirm a broader bullish breakout and could open the way toward $4,150–$4,160.
Above this region, the next major objective would be the previous swing area around $4,190–$4,200.
One-Hour Chart: Short-Term Buyers Stay Active
The one-hour chart presents a stronger short-term bullish structure.
Gold has moved above both moving averages and is currently testing the resistance area near $4,082–$4,085.
The one-hour RSI is trading near 65, confirming strong buying momentum.
However, the indicator is also approaching overbought territory, increasing the possibility of temporary consolidation or an intraday pullback.
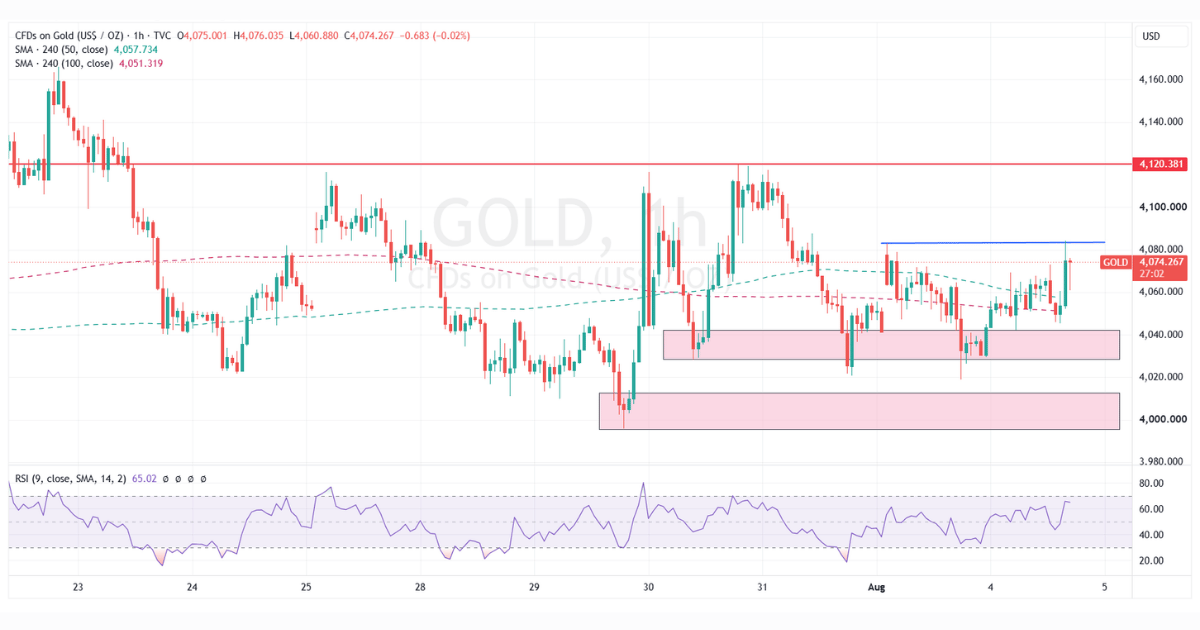 A clean hourly close above $4,085, followed by a successful retest, would provide stronger confirmation that buyers are targeting $4,100 and $4,120.
Without such confirmation, gold may continue trading inside the short-term range between approximately $4,040 and $4,085.
Key Support and Demand Zones
The first significant demand zone is located between $4,028 and $4,043.
Buyers have defended this area several times, making it the most important short-term support zone on both charts.
A controlled pullback into this region could attract fresh institutional demand, particularly if price forms a bullish rejection candle or another reversal structure.
Below this area, the deeper demand zone is positioned between approximately $3,994 and $4,010.
This region surrounds the psychological $4,000 level and represents the final major support before the lower boundary of the wider range.
As long as gold remains above $4,028, the near-term structure stays constructive.
A four-hour close below this level would weaken the recovery and increase the probability of a move toward $4,000.
A decisive break below $3,994 would expose the major horizontal support near $3,959 and return the market to a defensive structure.
Fundamental View: Gold Still Depends on the Dollar, Yields and Fed Expectations
From a fundamental perspective, gold continues to trade between competing macroeconomic forces.
Higher interest rates and elevated Treasury yields can restrict upside because gold does not generate interest income.
At the same time, expectations surrounding future Federal Reserve policy remain highly sensitive to US employment, inflation and economic growth data.
Weaker US economic releases could place pressure on the Dollar and bond yields, improving the probability of a gold breakout above $4,120.
Stronger data could support the Dollar, delay expectations of monetary easing and trigger another rejection from resistance.
Geopolitical uncertainty and persistent demand for defensive assets continue to provide underlying support for gold.
However, a sustained upside move will still require softer real yields, a weaker US Dollar or a fresh increase in safe-haven demand.
Bullish Scenario for Gold
The short-term technical bias remains cautiously bullish while gold holds above the $4,050 moving-average cluster.
A confirmed break above $4,085 would strengthen the recovery and increase the probability of a move toward $4,100 and $4,120.
The broader bullish breakout will remain unconfirmed until gold closes decisively above $4,120.
If that breakout happens, the next upside targets would be $4,150–$4,160, followed by $4,190–$4,200.
Pullbacks toward $4,050 or the $4,028–$4,043 demand zone may continue attracting buyers while the current structure remains intact.
Bearish Scenario for Gold
The bullish scenario would lose strength following a four-hour close below $4,028.
A deeper correction toward $4,000 could still produce a recovery, but it would indicate that bullish momentum has weakened considerably.
A decisive break below $3,994 would shift attention toward the major $3,959 support and increase the probability of a wider bearish continuation.
If gold breaks below $3,959, the broader consolidation structure would turn more defensive and sellers may regain stronger control.
BonusPips View
Gold buyers have regained short-term control above the $4,050 moving-average cluster, but the broader breakout is not confirmed yet.
The immediate resistance is $4,082–$4,085.
A clean break above this zone can open the way toward $4,100 and $4,120.
The real bullish confirmation will only come if gold closes decisively above $4,120.
Until then, gold remains inside a wider consolidation range between $3,959 and $4,120.
The key message is simple:
Gold remains cautiously bullish above $4,050, but buyers need a break above $4,085 first and a decisive close above $4,120 to confirm a stronger upside breakout.
On the downside, $4,028–$4,043 remains the key demand zone.
A break below $4,028 would weaken the recovery, while a decisive move below $3,994 would shift focus back toward $3,959.


0 Comments