
EUR/USD Technical Analysis: Euro Breaks Higher, but the Real Test Is Still Ahead
EUR/USD has made a strong recovery from the lower support zone, but the pair is now entering a major technical decision area.
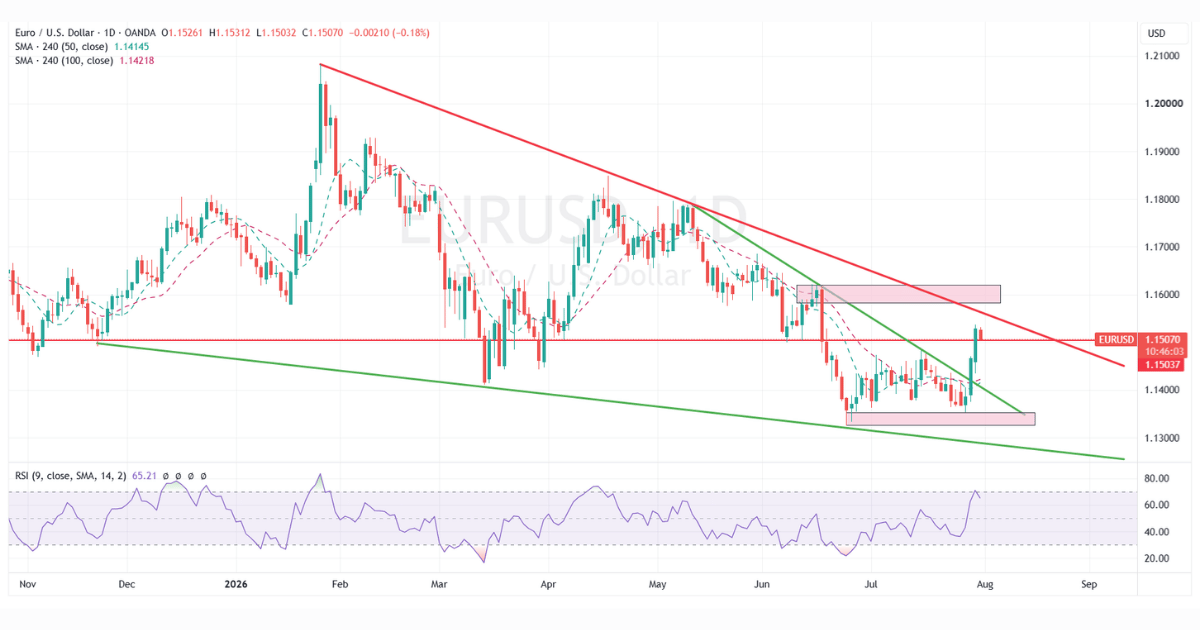
On the daily chart, the euro is trading near 1.1507 after a sharp rebound from the 1.1320–1.1350 demand region. The move is impressive because price has broken above the short-term falling green trendline and moved back above the 50-day and 100-day moving averages.
However, the larger structure has not fully turned bullish yet.
EUR/USD is still trading below the major red descending trendline that has been controlling the broader move since the January high. This means the pair has recovered strongly, but it has not yet confirmed a full trend reversal.
The current setup is simple:
EUR/USD has broken the short-term bearish structure, but it still needs to break the larger daily resistance to confirm a bigger bullish move.
Daily Chart: Strong Recovery From the Lower Channel
The daily chart shows that EUR/USD was previously moving inside a broad descending structure.
Price rejected the lower trendline near the 1.1320–1.1350 zone and then rallied sharply toward 1.1500.
This area is important because 1.1500 has acted as a major pivot level several times. When price trades above 1.1500, buyers usually become more confident. When price falls below it, sellers often regain control.
Right now, EUR/USD is sitting almost exactly at this battlefield.
The daily candle is holding around 1.1507, which means bulls have momentum, but they still need confirmation.
Moving Averages Turn Supportive
The chart shows the 50-day SMA near 1.14145 and the 100-day SMA near 1.14218.
EUR/USD is now trading above both moving averages.
This is technically positive.
It means the recent rally was strong enough to reclaim the medium-term moving-average zone. This area may now act as support if price pulls back.
As long as EUR/USD stays above 1.1410–1.1425, the recovery structure remains alive.
If price falls back below these moving averages, the breakout may start to look weak.
Daily Resistance: 1.1550 and 1.1580–1.1620
The next major resistance is the larger red descending trendline.
On the current chart, this trendline is coming in near the 1.1540–1.1560 region.
This is the first big test.
If EUR/USD breaks above this trendline, it would show that the daily bearish structure is weakening.
 Above that, the next supply zone is around:
1.1580–1.1620
This zone is clearly marked on the chart and has acted as a major rejection area before.
A clean daily close above 1.1620 would be a strong bullish signal. It would suggest that EUR/USD may be ready to move toward 1.1700, 1.1780 and possibly the previous swing zone near 1.1850.
But until EUR/USD breaks above 1.1620, the pair is still inside a wider bearish-to-neutral structure.
H4 Chart: Bullish Breakout From Consolidation
The 4-hour chart gives a clearer view of the short-term breakout.
EUR/USD was trapped for several weeks between the 1.1350 demand zone and the falling green trendline. Price then broke sharply above the trendline and moved quickly toward 1.1530–1.1540.
That breakout was important because it changed short-term momentum.
The pair is now holding above the broken trendline and above the moving-average zone. This gives buyers short-term control.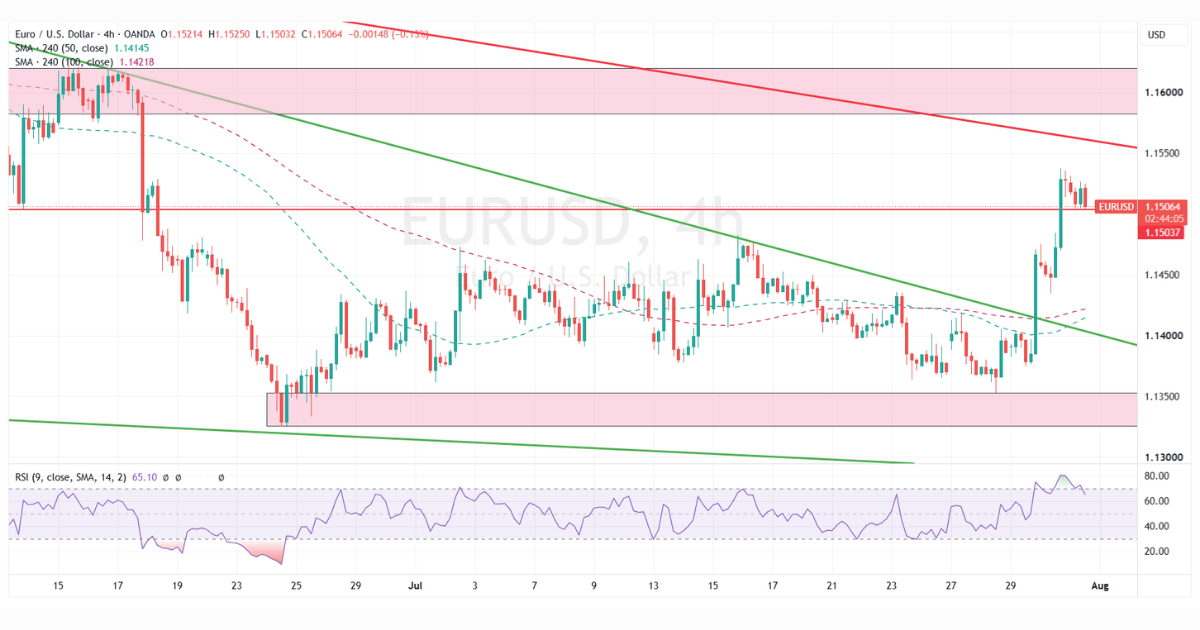
However, the H4 chart also shows that price is approaching a heavy resistance band between:
1.1580–1.1630
This means the short-term breakout is bullish, but buyers are now close to a supply area where sellers may return.
Immediate Support: 1.1500–1.1503
The first important support is now around:
1.1500–1.1503
This is the current horizontal level on both charts.
If EUR/USD holds above 1.1500, buyers may attempt another push toward 1.1550 and then 1.1580–1.1620.
But if price breaks below 1.1500, the pair may retest the breakout zone.
The first pullback area would be:
1.1450–1.1420
This is where the broken trendline and moving-average support may become important.
A pullback into this region would not automatically cancel the bullish setup. In fact, it could be a healthy retest if buyers defend it.
Major Support: 1.1320–1.1350
The strongest support on the chart is still:
1.1320–1.1350
This is the demand zone where the latest rally started.
As long as EUR/USD remains above this region, the medium-term bullish recovery remains possible.
A break below 1.1320 would be a major bearish signal because it would show that buyers have failed to defend the base of the structure.
In that case, EUR/USD could move toward 1.1270, 1.1200 and potentially lower levels.
RSI Shows Strong Momentum, but Pullback Risk Is Rising
The RSI on both the daily and H4 charts is near 65.
This is bullish because it shows strong upside momentum.
However, RSI is now close to the upper zone. It is not extremely overbought yet, but it is high enough to warn that the pair may need a pullback or consolidation before the next leg higher.
This means traders should be careful chasing EUR/USD aggressively at current levels.
The cleaner bullish setup would be either:
A confirmed break above 1.1550–1.1620
Or a pullback toward 1.1450–1.1420 followed by bullish rejection.
Fundamental View: Why EUR/USD Recovered
The recent EUR/USD recovery came from three main forces.
First, the U.S. Dollar lost strength after the Federal Reserve held interest rates unchanged. Even though the Fed did not sound fully dovish, the decision reduced immediate hike pressure and allowed traders to unwind some Dollar longs.
Second, U.S. growth data showed signs of slowing. The latest U.S. GDP reading came in weaker than expected, while inflation remains sticky. This creates a difficult setup for the Dollar because the Fed cannot easily sound dovish, but the growth side of the economy is no longer as strong as before.
Third, the euro has received some support from the European Central Bank’s policy stance. The ECB is not clearly dovish. It has kept the door open to further tightening if energy prices and war-related inflation risks continue to threaten price stability.
This is why EUR/USD has been able to rebound.
The Dollar side weakened, while the euro side did not collapse.
ECB Policy: Euro Gets Support From Inflation Risk
The ECB is facing a difficult situation.
The eurozone economy is not very strong, but inflation risks have returned because of higher energy prices and Middle East uncertainty. The ECB has already signalled that policy will remain data-dependent, but it has also made clear that it cannot ignore renewed inflation pressure.
This gives the euro some support.
If markets believe the ECB may hike again later this year, EUR/USD can stay supported on dips.
However, there is a risk.
If energy prices hurt eurozone growth more than they lift ECB rate expectations, the euro could come under pressure again.
So the euro’s bullish case is not purely strong. It depends on whether inflation risk creates hawkish ECB expectations without damaging growth too much.
Fed Policy: Dollar Still Not Fully Bearish
The Fed held rates, but it did not deliver a clean dovish message.
Some Fed officials remain worried about inflation. That means the Dollar may still find support if U.S. inflation data stays firm or Treasury yields rise again.
This is why EUR/USD bulls must be careful near resistance.
The current rally has been helped by Dollar weakness, but if the market starts pricing renewed Fed tightening risk, EUR/USD could struggle around 1.1550–1.1620.
The Dollar is weaker, but it is not dead.
Geopolitical and Energy Risk Remain Important
The war and energy-market uncertainty are still major macro risks for EUR/USD.
Europe is more sensitive to energy shocks than the U.S. If oil and gas prices rise sharply, the eurozone economy may face more pressure.
That could limit euro upside.
At the same time, higher energy prices can also keep inflation pressure alive, which may force the ECB to stay hawkish.
This creates a complicated reaction.
Energy risk can support the euro through ECB rate expectations, but it can also hurt the euro through weaker growth expectations.
That is why EUR/USD may remain volatile even if the technical breakout looks strong.
Bullish Scenario for EUR/USD
The bullish scenario is active if EUR/USD stays above 1.1500 and breaks above the red daily trendline near 1.1550.
A clean move above 1.1580–1.1620 would confirm stronger bullish momentum.
In that case, upside targets become:
1.1700
1.1780
1.1850
This scenario becomes stronger if:
The U.S. Dollar weakens further
Treasury yields fall
U.S. data disappoints
ECB guidance remains hawkish
Eurozone data stays stable
Risk sentiment remains constructive
Bearish Scenario for EUR/USD
The bearish scenario becomes stronger if EUR/USD fails near 1.1550–1.1620 and falls back below 1.1500.
A break below 1.1450–1.1420 would weaken the breakout structure.
A deeper break below 1.1350 would return the pair to a bearish setup.
Downside targets would then become:
1.1350
1.1320
1.1270
1.1200
This scenario becomes stronger if:
The Dollar recovers
Treasury yields rise
U.S. inflation remains sticky
Fed officials sound hawkish
Energy prices hurt eurozone growth
Risk sentiment turns defensive
What Traders Should Watch Next
The most important levels for EUR/USD are:
Resistance: 1.1550, 1.1580, 1.1620, 1.1700
Support: 1.1500, 1.1450, 1.1420, 1.1350, 1.1320
The most important fundamental drivers are:
U.S. inflation data
U.S. labour-market data
Treasury yields
Fed speeches
ECB comments
Eurozone inflation
Eurozone growth data
Energy prices
Middle East war headlines
Risk sentiment
The next move will likely depend on whether EUR/USD can break the daily red trendline or whether sellers defend the major resistance zone.
BonusPips View
EUR/USD has made a strong technical recovery, but the pair has not fully confirmed a bullish reversal yet.
The daily chart shows price above the 50-day and 100-day moving averages, which is positive. The H4 chart confirms a breakout above the short-term falling trendline, which gives buyers near-term control.
However, the bigger red daily trendline is still overhead, and the major supply zone at 1.1580–1.1620 remains the real test.
The key message is simple:
EUR/USD is bullish above 1.1500 in the short term, but a full bullish breakout needs a clean move above 1.1620. If price fails below this zone and falls back under 1.1450–1.1420, the recovery may lose strength.
Fundamentally, the euro is supported by softer Dollar momentum and ECB inflation concerns, but the pair remains vulnerable if U.S. yields rise again or energy risks damage eurozone growth.
For now, EUR/USD is in a breakout attempt, not a confirmed long-term reversal.


0 Comments