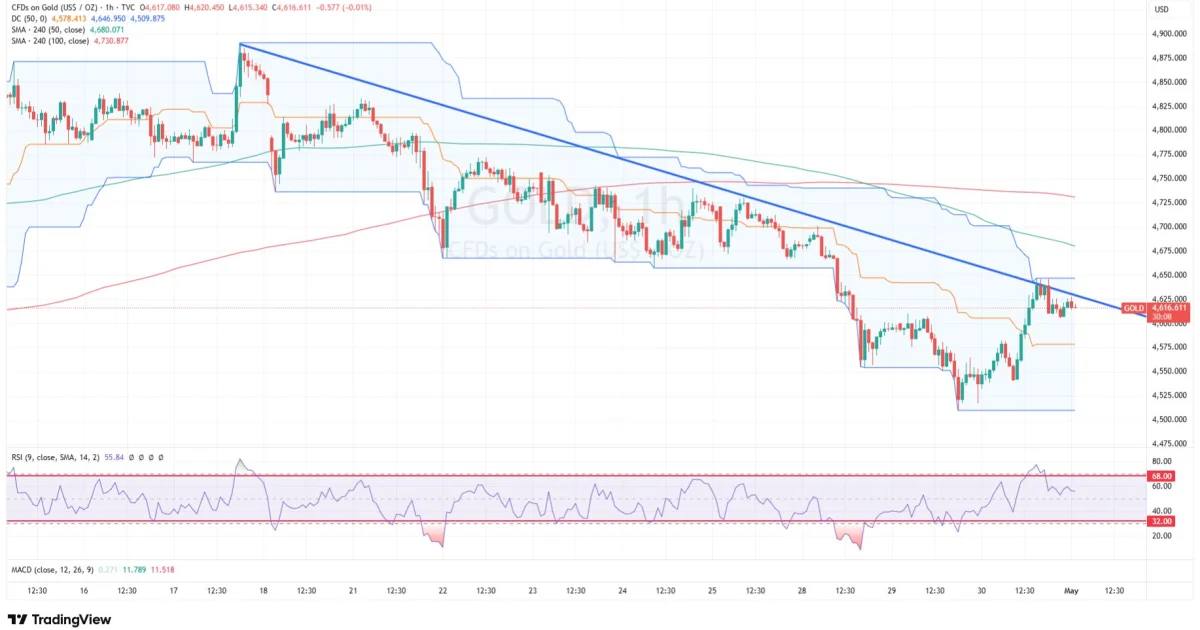
Gold Technical Analysis: Downside Pressure Remains Below Trendline Resistance
Gold is trying to recover from recent selling, but the chart still shows that the market remains under pressure unless buyers can force a stronger breakout. On this 1-hour chart, the structure still favors caution on the upside because price is trading under a falling trendline, the dynamic channel has already shown reversal pressure, RSI has cooled from overbought territory, and the longer-period SMAs are still pointing lower.
In simple terms, gold is attempting a bounce, but the bigger short-term structure is still weak. Buyers need a proper breakout to change the tone. Until that happens, the chart still leans slightly bearish.
Price is reacting at an important resistance zone
The clearest feature on the chart is the descending trendline from the recent highs. Gold has recovered from the lower part of the range and pushed back upward, but that rebound has run into this falling resistance line.
This is important because trendline resistance often acts as a decision point. If price keeps failing below it, sellers may step back in and push gold lower again. But if buyers manage to break above the line with strength, the short-term picture can improve quickly.
At the moment, price appears to be testing that resistance area rather than cleanly breaking it. That keeps the market at a technical crossroads.
Donchian Channel shows reversal, but not yet a confirmed trend change
The chart also shows a reversal inside the Donchian Channel structure. Price bounced from the lower side of the channel and managed to recover sharply, which tells us that short-term downside momentum slowed after the recent drop.
That rebound is meaningful, but it does not automatically confirm a full bullish reversal. In trending markets, price can often rebound inside a broader down move before meeting fresh resistance. That is exactly why the current area matters so much.
If the Donchian reversal continues and price breaks above trendline resistance, then the market may try to move toward the next higher resistance zones. But if this rebound stalls here, the reversal may end up being only a temporary correction inside a broader bearish structure.
RSI has already moved into overbought pressure and is cooling
The RSI on your chart pushed into the overbought area during the rebound and has started to ease back. That is another sign traders should respect.
When RSI enters or tests overbought territory during a recovery move, it often tells us that the bounce has already spent a good amount of energy. If price is also sitting under resistance at the same time, that combination can increase the chance of another pullback.
So the RSI is not just showing strength. It is also warning that gold may need a fresh trigger to continue higher. Without that trigger, the market can easily lose momentum again.
The moving averages still point to a weak bigger picture
Another important part of this chart is the slope of the SMAs. The higher-period moving averages are still pointing downward, which tells us the broader short-term trend has not fully turned.
This matters because moving averages help traders separate short-term bounce moves from real trend shifts. Right now, the rebound is happening while the larger moving average direction still suggests weakness. That is usually not the strongest environment for aggressive buying unless price can break above resistance and stay there.
So even though gold has bounced, the SMA structure is still telling traders to respect the downside risk.
Bearish case: rejection can send gold lower again
The bearish setup is quite straightforward here.
If gold continues to struggle below the descending trendline and RSI keeps fading from overbought levels, then the market may rotate lower again. In that case, traders would expect gold to retest nearby support zones and possibly move back toward the lower parts of the recent range.
This would fit the current chart logic:
- trendline resistance is still active
- the rebound is slowing
- RSI has already stretched higher
- SMAs still slope down
That combination keeps the downside scenario alive unless price proves otherwise.
Bullish case: a proper breakout can open a stronger upside move
At the same time, traders should not become blindly bearish here.
If gold breaks clearly above the trendline resistance and holds above it, the market can shift tone quickly. A real breakout would show that buyers are no longer just bouncing from oversold conditions, but are starting to regain control.
In that bullish case, gold could try to push toward the next resistance levels visible on the chart and possibly challenge higher moving-average zones. That is why this current area is so important. It is not just resistance — it is the line between a temporary bounce and a more meaningful recovery.
So the chart currently says this:
below resistance, gold still looks vulnerable
above resistance, gold may unlock more upside
Why headline risk still matters for gold
Even though this chart is technical, gold is not trading in a vacuum. The market is still highly sensitive to developments around the Middle East war and President Trump’s next moves.
Reuters reported on April 30 that efforts to resolve the conflict remain stuck, with a ceasefire in place since April 8 but the Strait of Hormuz still blocked in response to the U.S. naval blockade, keeping energy markets under pressure. Reuters also reported that Trump formally notified Congress after the conflict began, starting a 60-day clock that reaches May 1, which keeps political and military risk in focus.
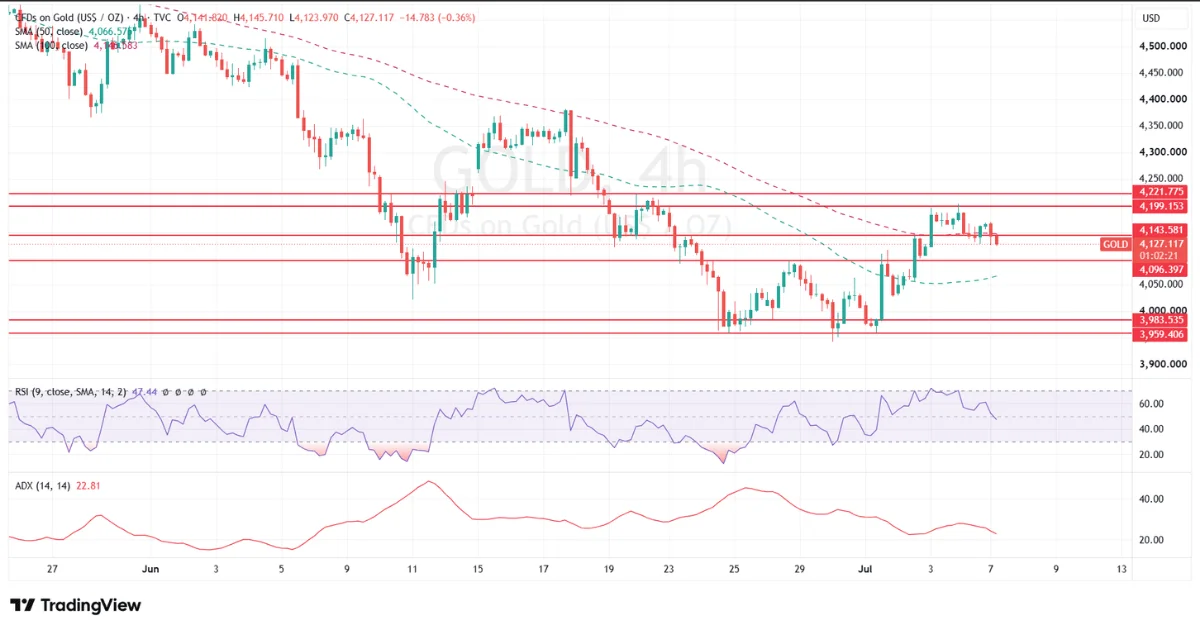
That matters for gold because renewed escalation can quickly bring safe-haven buying back into the market. Reuters also reported this week that gold had recently fallen to a one-month low near $4,528 after the Fed decision, showing that gold remains highly reactive to inflation concerns, war headlines, and shifts in risk sentiment.
So while the chart is currently leaning cautious below resistance, traders should stay alert. A major geopolitical headline can change momentum very quickly.
Trading view in simple words
Right now, the technical picture suggests that gold is still in a fragile rebound inside a broader weak structure.
The market has bounced from lower levels, but it is now meeting:
- descending trendline resistance
- fading RSI momentum after overbought conditions
- downward-sloping higher-period SMAs
That means the path of least resistance still looks slightly lower unless buyers break this ceiling properly.
Final takeaway
Gold is trying to recover, but the chart still favors caution while price remains below trendline resistance. The Donchian Channel reversal shows that sellers lost some short-term control, but RSI overbought pressure and downward SMAs suggest the rebound may still be vulnerable.
The key level to watch is the trendline.
If gold stays below it, another move lower remains possible.
If gold breaks above it with strength, the market can turn more bullish and push toward higher resistance zones.
At the same time, traders should keep one eye on the chart and one eye on the headlines. Any major development in the Middle East or from Trump can quickly shift sentiment and change the direction of gold.
0 Comments