AUD/USD Technical Analysis: Key Support in Focus as H4 Butterfly Pattern Signals Possible Rebound
AUD/USD is trading at an important technical area, with the daily chart testing a major support zone while the 4-hour chart is showing early signs of recovery. Based on the charts shared, the pair is sitting near a level that could decide whether the broader bullish structure remains intact or shifts into a deeper correction.
On the daily chart, AUD/USD is now trading close to a critical support region around 0.6830–0.6800. This area is important because it aligns with the lower end of the recent bullish wave and is also near the 100-day SMA, which is acting as dynamic support. Price has already reacted from this zone, which suggests buyers are still defending the broader uptrend for now.
Even though the daily structure is under pressure, it is not fully bearish yet. The pair is trading below the 50-day SMA near 0.7026, which shows that momentum has weakened in the short term, but it is still holding above the deeper trend support area. That keeps the larger bullish outlook alive as long as the market stays above the 0.6800 handle.
The daily RSI, which is around the low-40s, is also showing that bearish momentum has cooled from more stretched conditions. It is not yet a strong bullish signal, but it does suggest the selling pressure is no longer as aggressive as it was during the recent decline. This means the current area is more of a decision zone than a confirmed breakdown zone.
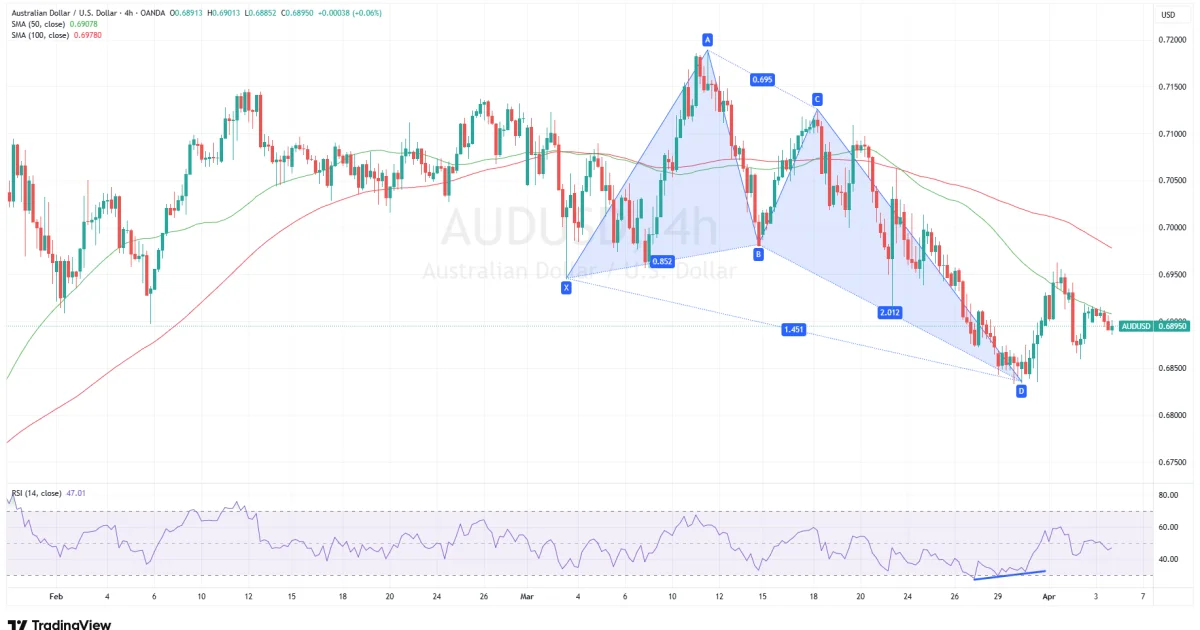
On the 4-hour chart, the picture is slightly different. The short-term trend is still weaker because price remains under both the 50-period SMA near 0.6908 and the 100-period SMA near 0.6978. That tells us the pair is still in a short-term corrective phase. However, there is also an important positive development here: a butterfly harmonic pattern appears to have completed near the recent low, and the RSI has bounced back from oversold territory.
That combination is meaningful. A completed butterfly pattern near support often signals exhaustion in the prior move, and the RSI rebound adds to the idea that sellers may be losing control in the near term. This does not guarantee a strong rally, but it does raise the probability of a corrective bounce or even a broader recovery if resistance levels start breaking.
For the upside, the first important level to watch is 0.6900–0.6910, which is the immediate pivot area and also near the 4-hour 50 SMA. If buyers can push and hold above that zone, the next resistance comes around 0.6950, followed by 0.6978–0.7000, where the 4-hour 100 SMA and the psychological round number sit. A clean move above 0.7000 would improve sentiment further and could open the way toward 0.7025–0.7050, with stronger resistance higher up around 0.7100–0.7150.
On the downside, the main support remains 0.6830, followed by 0.6800. This is the area keeping the daily bullish wave alive. If AUD/USD falls back below this zone and closes under it, that would weaken the recovery idea and increase the chances of a deeper move toward 0.6750 and possibly 0.6700 later.
In simple terms, AUD/USD is sitting at a very important technical level. The daily chart says support is being tested, while the 4-hour chart says a rebound may be starting. The butterfly completion and RSI recovery on H4 are early positive signs, but the pair still needs to reclaim nearby resistance levels to turn that into a stronger bullish confirmation.
Important levels to watch
Support:
0.6830
0.6800
0.6750
0.6700
Resistance:
0.6900–0.6910
0.6950
0.6978–0.7000
0.7025–0.7050
0.7100–0.7150
The broader structure on AUD/USD is still trying to hold bullish support, but short-term confirmation is needed. As long as the pair stays above 0.6830–0.6800, the market still has room for a rebound toward 0.6950 and 0.7000. A break below support, however, would shift focus to a deeper bearish continuation.
0 Comments